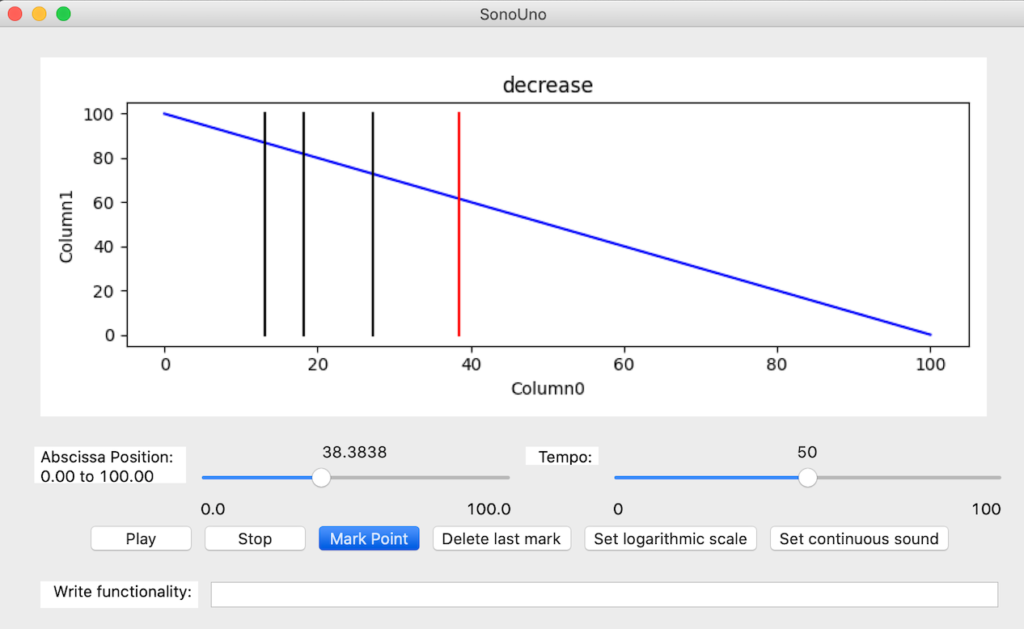
This button allows the user to mark a specific coordinate from the data. When the button is pressed save the current position on a vector and plot it with a vertical black line. The position on the frame is on the center bottom, under the sliders of abscissa and tempo (Image 37).
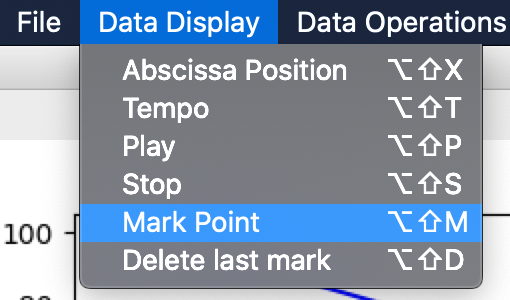
In parallel, the user can mark a point on the graph with the item mark point of the data display menu (Image 38), or the shortcut key ‘Alt+Shift+M’ or ‘Option+Shift+M’. Both methods do the same action directly without modifying the keyboard focus.