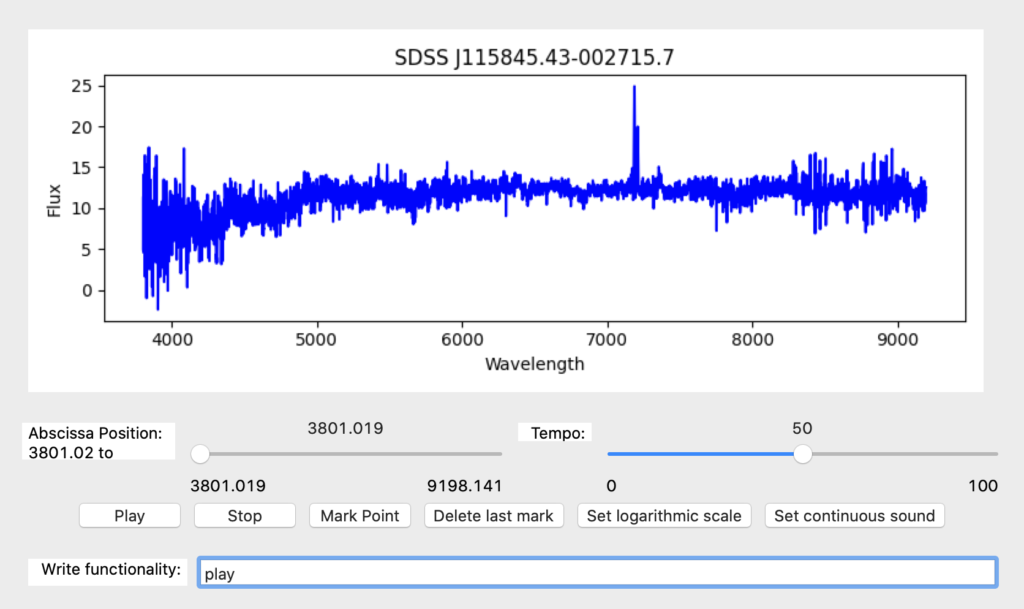
Here we introduce how to use the sonoUno’s octave functionality. Now to apply different commands the user has to use the ‘Write functionalities’ element (Image 60) and write ‘octave(one_command)’. The output of octave is shown on the octave panel.

NOTE: When the user opens some data on the software, automatically the first two columns of the data are sent to octave with the names x and y. In addition, all the columns are sent to octave with the column names as variables names. Then, when the user makes some changes on the data, the variables x and y are updated on octave. This is important, because the user does not need to make any steps to send the plotted data to octave, instead the software performs this task automatically, and conserves the original data with the column names.
-To open the octave panel, you have to go to the menu Panels, then submenu Data operations, and finally, the item Octave (Image 62).

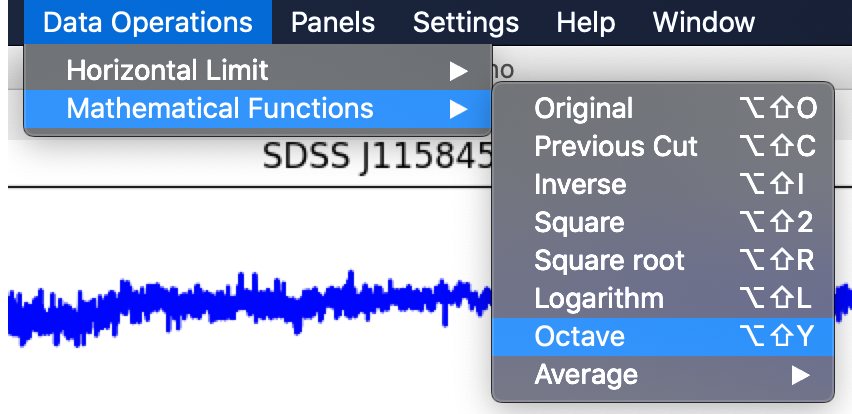
Another way to open it is with the Octave item from the sub-menu Mathematical functions on the Data operations menu (Image 63).

When this item is checked, the octave panel is shown (Image 64). This panel is located under the Write functionality element and above the mathematical function panel.

On the left of this panel contains an information text box and its label “Octave info”, where the software writes the octave output. On the right of this panel, the retrieve from the octave section is located. The first row displays the label and the second row contains the text box to write the name of the variable to place on the x axis and its label ‘Name of x array’. Then, the third row presents the same elements but for the y axis. Finally, there is a button named ‘Refresh the plot’, which one display the new variables in the plot section.

